AcuRite® Atlas™
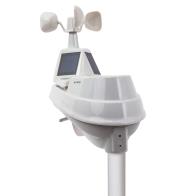 The AcuRite® Atlas™ Weather Station delivers key information on current outdoor environmental conditions at its installation location. The Outdoor Device contains sensors that take readings for outdoor environmental conditions - including temperature, humidity, wind speed and direction, rainfall, UV, light intensity, and lightning strikes (requires optional Lightning Detection Sensor).
The Outdoor Device broadcasts its readings over a 433 MHz wireless radio frequency (RF) and the readings are received by either a AcuRite Indoor Display or AcuRite Atlas, or both depending upon your setup. An AcuRite Access sends the readings received from the Outdoor Device to My AcuRite and also to Weather Underground (requires additional setup).
Your Dashboard displays the last received readings uploaded by an AcuRite Access to My AcuRite and the readings are also displayed in Charts & Details. The Dashboard also displays the Forecast and Location Details of the AcuRite Access.
Provided below are the details of sensor reading frequencies, the upload frequency to My AcuRite and Weather Underground, how readings are displayed in My AcuRite, the types of readings displayed, and an example of a Dashboard.
AcuRite Atlas (outdoor device) - reading frequency specifications
The table below defines how frequent a reading is taken by each sensor locally at the outdoor device.
|
Sensor Type |
Reading Frequency |
|---|---|
| Temperature | every 30 seconds |
| Humidity | every 30 seconds |
| Wind Speed | every 10 seconds |
| Wind direction | every 30 seconds |
| Rain | every 30 seconds |
| UV Index | every 30 seconds |
| Light Intensity |
every 30 seconds |
| Lightning | every 10 seconds |
How often are readings sent to My AcuRite (upload frequency)?
AcuRite Access - the most recent received readings are uploaded to My AcuRite every 5 minutes.
Calculated reading types, such as Dew Point and Feels Like, are calculated locally by the device and uploaded to My AcuRite. Reading calculations are based on all readings taken by each sensor during each 5 minute interval.
Accumulated reading types, including rainfall,
When an AcuRite Access device is operating on battery backup power or it does not have a network (internet) connection, its readings are not sent (uploaded) to My AcuRite or Weather Underground. During battery backup use or when it does not have a network (internet) connection, the device continues to receive readings and stores up to 12 hours of readings (logged readings) in its local memory. All logged readings are sent (uploaded) to My AcuRite when its AC power or network (internet) connection is restored. Logged readings are not sent to Weather Underground.
AcuRite Atlas is not compatible with PC Connect or the AcuRite smartHUB.
How often are readings sent to Weather Underground (upload frequency)?
AcuRite Access - the sensor's outdoor readings are sent (uploaded) to Weather Underground by way of Rapid Fire updates at the time the readings are received by the device from an outdoor device. The frequency readings are received by the device is based on each sensor's reading frequency.
When an AcuRite Access device is operating on battery backup power or it does not have a network (internet) connection, logged readings are not sent (uploaded) to Weather Underground.
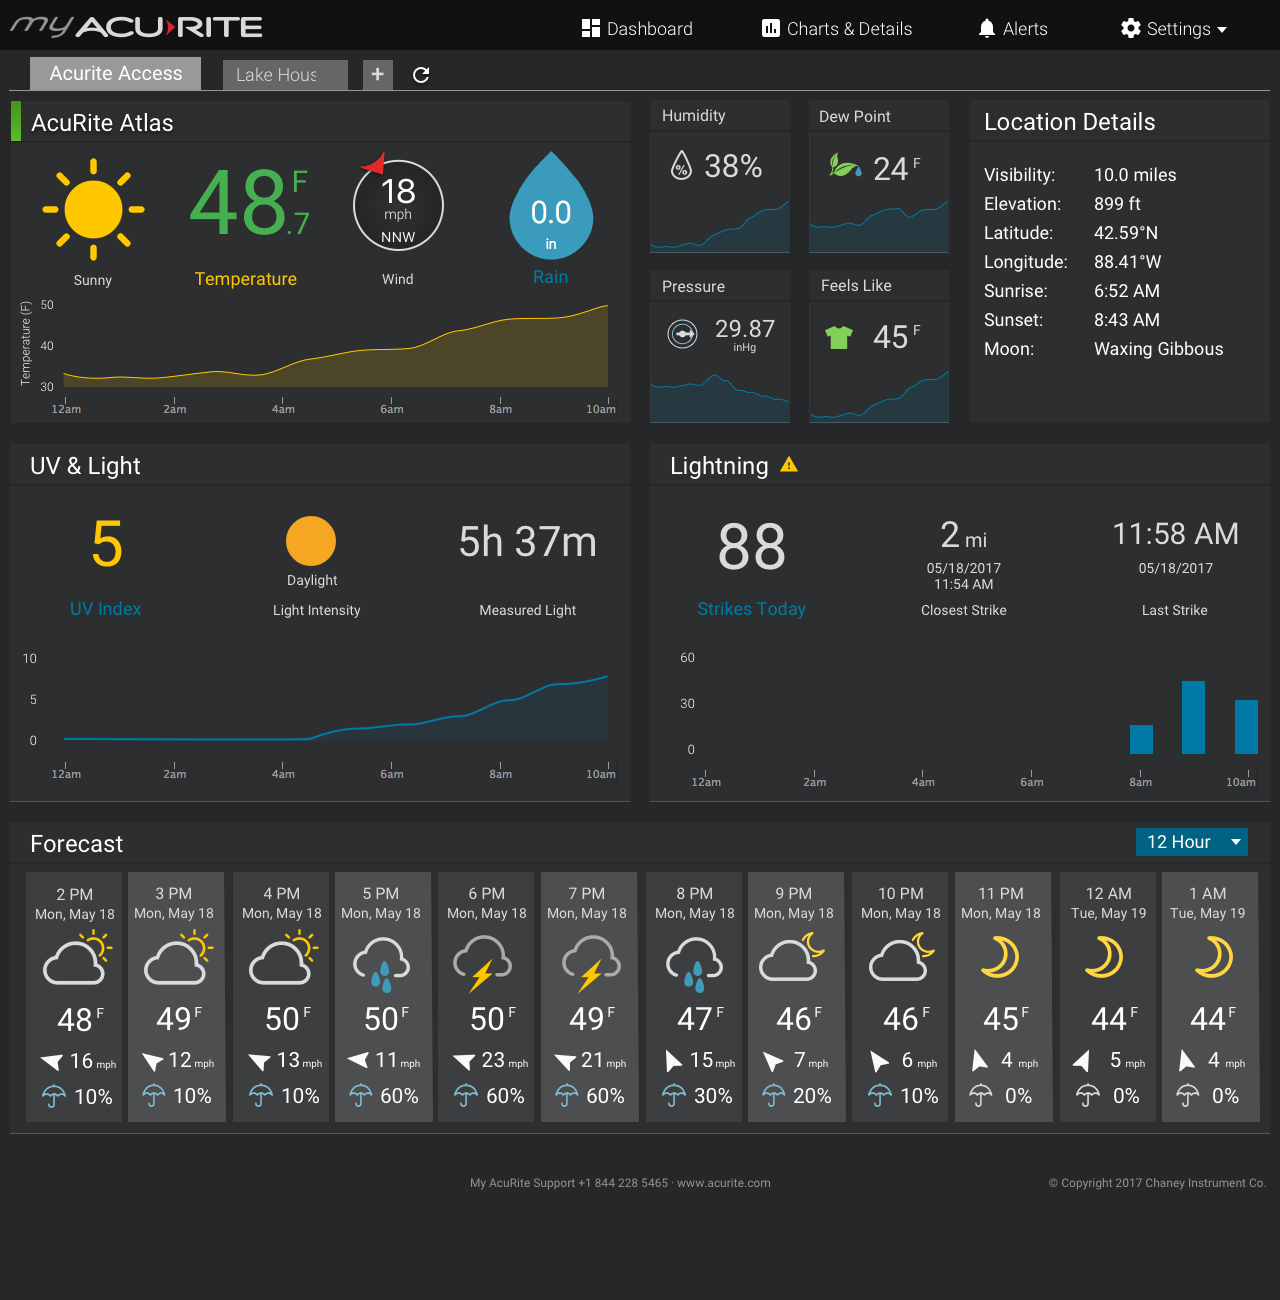
How are the uploaded readings displayed in My AcuRite?
- The Dashboard
- From the Dashboard, the current reading displayed for each reading type is the last received reading uploaded from an AcuRite Connection Device.
- Each single reading uploaded to My AcuRite is used to generate calculated readings (e.g., Heat Index, Wind Chill, Feels Like, Rain Rate). Calculated Readings are also displayed on the Dashboard and in Charts & Details.
As an example, a temperature reading is taken every 30 seconds - it's expected that 10 temperature readings are sent to My AcuRite every 5 minutes by an AcuRite Access device. The last received temperature reading is displayed on the Dashboard and Temperature Chart, and the additional 30 second readings are used by My AcuRite to generate the calculated readings.
What readings are is displayed for an Atlas Environmental Monitoring System?
 Current Condition
An indicator of the current weather conditions at the address or zip code set in the profile of a Connection Device AcuRite Access, smartHUB, PC Connect). Data is provided by our partner Dark Sky.
The weather icon and text represents the current condition - providing useful information at a glimpse. The icons clearly distinguish the weather conditions such as sunny, rainy, stormy, cloudy, and more.
 Temperature
Temperature refers the measurement of air, liquid or soil in Fahrenheit or Celsius.
Temp High - the highest recorded temperature reading in the interval of time being viewed.
Temp Low - the lowest recorded temperature reading in the interval of time being viewed.
 Dew Point
Dew Point is the temperature at which the air becomes fully saturated with water vapor (i.e. 100% humidity).
Dew Point High - the highest Dew Point measurement in the interval of time being viewed.
Dew Point Low - the lowest Dew Point measurement in the interval of time being viewed.
 Feels Like temperature
The Feels Like temperature is a measurement of how hot or cold it really feels outside. The Feels Like temperature is calculated and displayed when temperatures are between 40° to 80° Fahrenheit (4° to 27° Celsius).
Feels Like High - the highest Feels Like measurement in the interval of time being viewed.
Feels Like Low - the lowest Feels Like measurement in the interval of time being viewed.
 Heat Index
Heat index is a measurement of how hot it feels outside and is only calculated and displayed when temperatures exceed 80° Fahrenheit (27 ° Celsius).
Heat Index High - the highest Heat Index measurement in the interval of time being viewed.
 Wind Chill
Wind Chill is a measure of how cold it really feels outside and is only calculated and displayed when temperatures are below 40° Fahrenheit (4° Celsius).
Wind Chill Low - the lowest Wind Chill measurement in the interval of time being viewed.
 Humidity
Humidity, or relative humidity, is the ratio of moisture in the air as compared to the maximum amount of moisture the air can hold, which varies depending on the air temperature.
Humidity High - the highest recorded Humidity reading in the interval of time being viewed.
Humidity Low - the lowest recorded Humidity reading in the interval of time being viewed.
 Rain
Rain
Rainfall is the amount of rain measured.
Rain Total - the total rainfall amount recorded for the current day.
Rain High - the highest total rain measurement in the interval of time being viewed.
 Wind
Wind
Wind Speed is the measurement of movement of air in the atmosphere.
Current Wind Speed - the latest reading of wind speed measured in mph, km/h, or kn.
Wind Direction - the direction air is blowing from in the atmosphere.
Wind Speed High - the highest Wind Speed measurement in the interval of time being viewed.
Wind Speed Average - the average of all Wind Speed measurements within the time period specified.
 Pressure
Pressure, or barometric pressure, is the weight of the air at a specific location, measured in Inches of Mercury (inHg) or Hectopascals (hPa).
Pressure High - the highest Pressure measurement in the interval of time being viewed.
Pressure Low - the lowest Pressure measurement in the interval of time being viewed.
Rain
Rainfall is the amount of rain measured.
Rain Total - the total rainfall amount recorded for the current day.
Rain High - the highest total rain measurement in the interval of time being viewed.
 UV
UV
Short for Ultraviolet, UV is a type of radiation that is primarily produced by the sun. The UV Index level is the measurement of the strength of the sun’s UV rays. The UV Index is affected by a number of factors including the time of day, time of year, cloud cover, altitude, how close you are to the equator, scattering and reflection.
UV Index Scale
The UV Index Scale provides important information to help you plan your outdoor activities in ways that prevent overexposure to the sun's rays. It was designed by the National Weather Service (NWS) and the Environmental Protection Agency (EPA). The higher the number, the stronger the rays that equal higher risk.
Low - displayed when the UV index reading is 2 or less.
Moderate - displayed when the UV index reading is 3 to 5
High - displayed when the UV index reading is 6 to 7.
Very High - displayed when the UV index reading is equal to 8 to 10.
Extreme - displayed when the UV index reading is 11 or higher.
 Light Intensity
The Atlas outdoor Light Intensity Sensor detects and measures the intensity of outdoor sunlight or illumination at its installation location. Measurements are taken in the form of a lux, which is the amount of light output in a given area.
My AcuRite also generates a Measured Light calculated reading - which is defined as the amount of time that the light intensity readings have been at 1,000 lux or greater. By monitoring and understanding measured light hours at your actual location, you can improve your garden growth and health, and even better plan your outdoor activities.
By monitoring and understanding measured daylight hours at your actual location, you can improve your garden growth and health, and even better plan your outdoor activities.
The light intensity scale is based on the last received lux reading as defined below.
Dark/Night - displayed when the light intensity reading is equal to 0 to 500 lux.
Low Light - displayed when the light intensity is equal to 501 to 5,380 lux.
Overcast/Shade - displayed a when the light intensity reading is equal to 5,381 to 21,520 lux.
Daylight - displayed when the light intensity reading is equal to 21,521 to 43,050 lux.
Direct Sun - displayed when the light intensity reading is equal to 43,051 lux or greater.
Lightning
The Atlas Lightning Detection Sensor (optional component) allows you to identify and monitor the presence of potentially dangerous lightning strikes as far as 25 miles (40 kilometers) away, more than twice the distance before you can start to hear thunder, giving you more time to prepare for the oncoming storm.
The lightning detector system will not provide a perfect count of actual lightning strikes with perfect distance estimates. In most cases, the system will be rather accurate, but there will always be a few discrepancies. The Atlas lightning detector system should be used for general safety and lightning awareness.
How does it work?
The Atlas lightning detector system uses a radio that listens for lightning at 500 KHz, it listens for a particular radio signal pattern. The lightning signal pattern is generated by the electrical “spark” that is the lightning itself. The system can be susceptible to detecting erroneous lightning strikes. The same signal “spark” can be artificially generated by many different man-made sources - including radio towers, power plants, garage door motors, the ignition system on a car, starting an electrical motor, flipping a light switch and more.
The system does utilize filters to isolate and reduce as many errors as possible, but some “erroneous” signals will still get through. If the filter system was designed to be more robust and more discriminating, it would also be less sensitive to lightning and may not pick up the small distance strikes.
Lighting data details
If there were no lightning strikes detected today, NA is displayed for each reading type.
Strikes today: total number of lightning strikes detected today.
Closet Strike: distance and date/time of the closest recorded lightning strike for today.
Last Strike: time that the last lightning strike was detected today.
The Dashboard 12 hour chart displays a y-axis (strike count) and x-axis (time) labels.