5-in-1 Weather Station
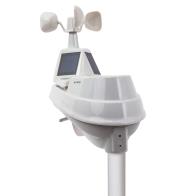 The AcuRite 5-in-1 Weather Station measures five environmental conditions - temperature, humidity, wind speed, wind direction, and rainfall.
The Outdoor Device broadcasts its readings over a wireless radio frequency (RF) and the readings are received by an AcuRite Connection Device. A Connection Device uploads the readings received from the Outdoor Device to My AcuRite and also to Weather Underground (requires additional setup).
Your Dashboard displays the last received readings uploaded by a Connection Device to My AcuRite and the readings are also displayed in Charts & Details. The Dashboard also displays the Forecast and Location Details of the Connection Device.
Provided below are the details of sensor reading frequencies, the upload frequency to My AcuRite and Weather Underground, how readings are displayed in My AcuRite, the types of readings displayed, and an example of a Dashboard.
5-in-1 Weather Station - reading frequency specifications
The table below defines how frequent a reading is taken by each sensor locally at the outdoor device.
|
Sensor Type |
Reading Frequency |
|---|---|
| Temperature | every 36 seconds |
| Humidity | every 36 seconds |
| Wind Speed | every 18 seconds |
| Wind direction | every 36 seconds |
| Rain | every 36 seconds |
How often are readings sent to My AcuRite (upload frequency)?
The frequency that readings are sent to My AcuRite is dependent on the type AcuRite Connection device.
AcuRite Access - the most recent received readings are uploaded to My AcuRite every 5 minutes.
Calculated reading types, such as Dew Point and Feels Like, are calculated locally by the device and uploaded to My AcuRite. Reading calculations are based on all readings taken by each sensor during each 5 minute interval.
Accumulated reading types, including rainfall,
When an AcuRite Access device is operating on battery backup power or it does not have a network (internet) connection, its readings are not sent (uploaded) to My AcuRite or Weather Underground. During battery backup use or when it does not have a network (internet) connection, the device continues to receive readings and stores up to 12 hours of readings (logged readings) in its local memory. All logged readings are sent (uploaded) to My AcuRite when its AC power or network (internet) connection is restored. Logged readings are not sent to Weather Underground.
AcuRite smartHUB - readings are uploaded to My AcuRite at the time a reading is received from an AcuRite outdoor or indoor monitoring device (sensor) by the smartHUB. The upload frequency is based on each sensors' reading frequency.
PC Connect (for use with a 5-in-1 weather station only) - the readings of a 5-in-1 Weather Station are sent to PC Connect by way of the USB connection between the Indoor Display and your computer. Readings are uploaded to My AcuRite over your computer's network (internet) connection. For PC Connect use, My AcuRite sharing must be enabled in the PC Connect software. The upload frequency is based on each of the 5-in-1 sensors' reading frequency.
How often are readings sent to Weather Underground (upload frequency)?
The frequency that readings are sent to Weather Underground are dependent on the type AcuRite Connection Device and the reading frequency of each sensor.
AcuRite Access - the sensor's outdoor readings are sent (uploaded) to Weather Underground by way of Rapid Fire updates at the time the readings are received by the device from an outdoor device. The frequency readings are received by the device is based on each sensor's reading frequency.
When an AcuRite Access device is operating on battery backup power or it does not have a network (internet) connection, logged readings are not sent (uploaded) to Weather Underground.
smartHUB Connection Device - the sensor's outdoor readings are sent (uploaded) to Weather Underground by way of Rapid Fire updates at the time the readings are received by the smartHUB device from an outdoor device. The frequency readings are received by the device is based on each sensor's reading frequency.
PC Connect software (for use with a 5-in-1 weather station only) - all readings received by the PC Connect software are sent (uploaded) to Weather Underground every 12 minutes. If Rapid Updates is enabled, readings are sent every 36 seconds.
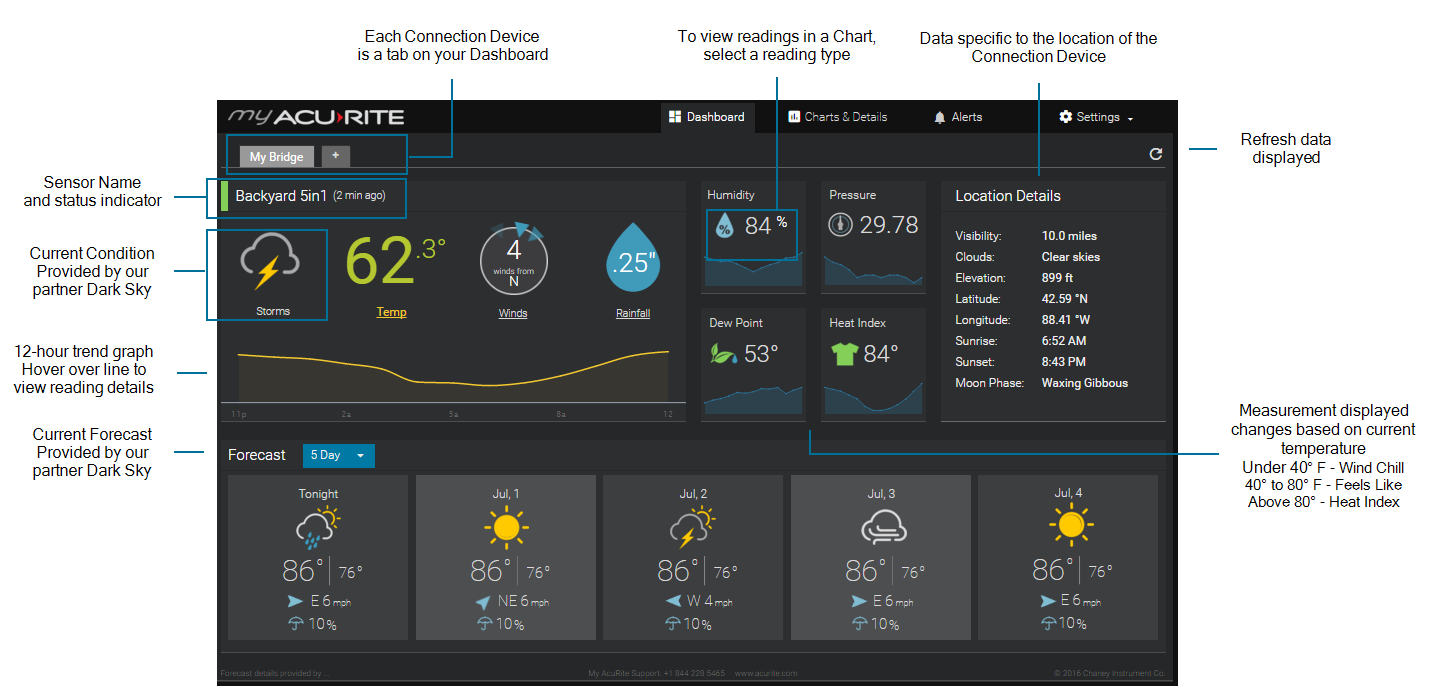
How are the uploaded readings displayed in My AcuRite?
- The Dashboard
- From the Dashboard, the current reading displayed for each reading type is the last received reading uploaded from an AcuRite Connection Device.
- Each single reading uploaded to My AcuRite is used to generate calculated readings (e.g., Heat Index, Wind Chill, Feels Like, Rain Rate). Calculated Readings are also displayed on the Dashboard and in Charts & Details.
As an example, a 5-in-1 temperature reading is taken every 36 seconds - it's expected that 8 temperature readings are sent to My AcuRite every 5 minutes by an AcuRite Access device. The last received temperature reading is displayed on the Dashboard and Temperature Chart, and the additional 36 second readings are used by My AcuRite to generate the calculated readings.
What readings are is displayed for a 5-in-1 Weather Station?
 Current Condition
An indicator of the current weather conditions at the address or zip code set in the profile of a Connection Device AcuRite Access, smartHUB, PC Connect). Data is provided by our partner Dark Sky.
The weather icon and text represents the current condition - providing useful information at a glimpse. The icons clearly distinguish the weather conditions such as sunny, rainy, stormy, cloudy, and more.
 Temperature
Temperature refers the measurement of air, liquid or soil in Fahrenheit or Celsius.
Temp High - the highest recorded temperature reading in the interval of time being viewed.
Temp Low - the lowest recorded temperature reading in the interval of time being viewed.
 Dew Point
Dew Point is the temperature at which the air becomes fully saturated with water vapor (i.e. 100% humidity).
Dew Point High - the highest Dew Point measurement in the interval of time being viewed.
Dew Point Low - the lowest Dew Point measurement in the interval of time being viewed.
 Feels Like temperature
The Feels Like temperature is a measurement of how hot or cold it really feels outside. The Feels Like temperature is calculated and displayed when temperatures are between 40° to 80° Fahrenheit (4° to 27° Celsius).
Feels Like High - the highest Feels Like measurement in the interval of time being viewed.
Feels Like Low - the lowest Feels Like measurement in the interval of time being viewed.
 Heat Index
Heat index is a measurement of how hot it feels outside and is only calculated and displayed when temperatures exceed 80° Fahrenheit (27 ° Celsius).
Heat Index High - the highest Heat Index measurement in the interval of time being viewed.
 Wind Chill
Wind Chill is a measure of how cold it really feels outside and is only calculated and displayed when temperatures are below 40° Fahrenheit (4° Celsius).
Wind Chill Low - the lowest Wind Chill measurement in the interval of time being viewed.
 Humidity
Humidity, or relative humidity, is the ratio of moisture in the air as compared to the maximum amount of moisture the air can hold, which varies depending on the air temperature.
Humidity High - the highest recorded Humidity reading in the interval of time being viewed.
Humidity Low - the lowest recorded Humidity reading in the interval of time being viewed.
 Rain
Rain
Rainfall is the amount of rain measured.
Rain Total - the total rainfall amount recorded for the current day.
Rain High - the highest total rain measurement in the interval of time being viewed.
 Wind
Wind
Wind Speed is the measurement of movement of air in the atmosphere.
Current Wind Speed - the latest reading of wind speed measured in mph, km/h, or kn.
Wind Direction - the direction air is blowing from in the atmosphere.
Wind Speed High - the highest Wind Speed measurement in the interval of time being viewed.
Wind Speed Average - the average of all Wind Speed measurements within the time period specified.
 Pressure
Pressure, or barometric pressure, is the weight of the air at a specific location, measured in Inches of Mercury (inHg) or Hectopascals (hPa).
Pressure High - the highest Pressure measurement in the interval of time being viewed.
Pressure Low - the lowest Pressure measurement in the interval of time being viewed.
Rain
Rainfall is the amount of rain measured.
Rain Total - the total rainfall amount recorded for the current day.
Rain High - the highest total rain measurement in the interval of time being viewed.