Lightning Chart
The Lightning Chart displays the lightning strikes detected by an AcuRite Atlas Lightning Detection Sensor, along with reading records.
Monitoring lightning strikes
The Atlas Lightning Detection Sensor (optional component) allows you to identify and monitor the presence of potentially dangerous lightning strikes as far as 25 miles (40 kilometers) away, more than twice the distance before you can start to hear thunder, giving you more time to prepare for the oncoming storm.
The lightning detector system will not provide a perfect count of actual lightning strikes with perfect distance estimates. In most cases, the system will be rather accurate, but there will always be a few discrepancies. The Atlas lightning detector system should be used for general safety and lightning awareness.
How does it work?
The Atlas lightning detector system uses a radio that listens for lightning at 500 KHz, it listens for a particular radio signal pattern. The lightning signal pattern is generated by the electrical “spark” that is the lightning itself. The system can be susceptible to detecting erroneous lightning strikes. The same signal “spark” can be artificially generated by many different man-made sources - including radio towers, power plants, garage door motors, the ignition system on a car, starting an electrical motor, flipping a light switch and more.
The system does utilize filters to isolate and reduce as many errors as possible, but some “erroneous” signals will still get through. If the filter system was designed to be more robust and more discriminating, it would also be less sensitive to lightning and may not pick up the small distance strikes.
Lightning strike count
The Lightning Detection Sensor tracks the amount of lightning strikes detected during a storm, allowing you to monitor detailed conditions and better understand the risks and impact.
Lightning strike distance
With an estimated distance to each detected strike, you have a clearer picture of the risks of lightning strikes in your actual location, helping you better evaluate the danger and distance to the storm.
Chart details
The chart is displayed as a bar graph - each bar represents the count of lightning strikes detected for the time period selected.
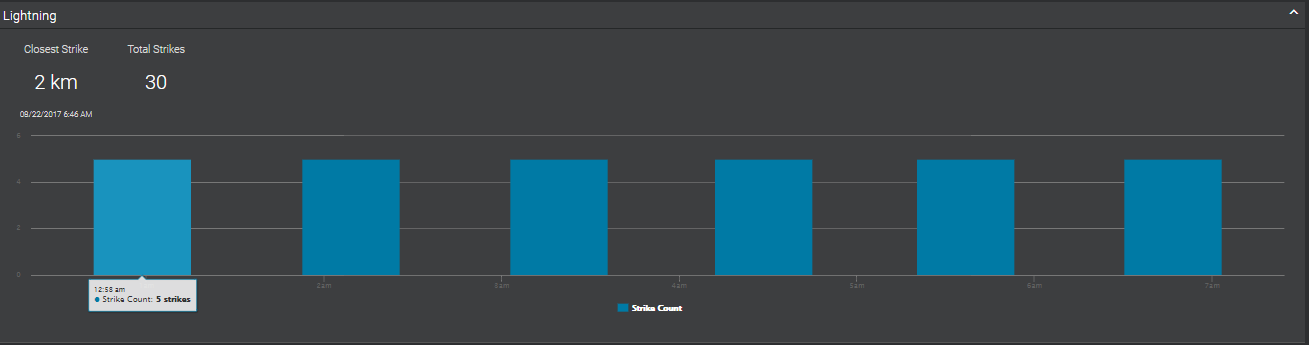
Hover over a data point to display its detailed reading information.
Reading records
My AcuRite display various reading records for the time period selected.
Closet Strike - the distance and date/time of the closest recorded lightning strike. If there were no lightning strikes detected for the time period selected, NA is displayed.
Total Strikes - the total number of lightning strikes detected for the time period selected.
Last Strike - is only displayed when the Year or All Time period is selected. Displays the date of the last lightning strike detected.