View readings in charts
Charts are good for showing changes in the value of your sensor readings over a series of points in time, such as week to week.
How to view readings in charts
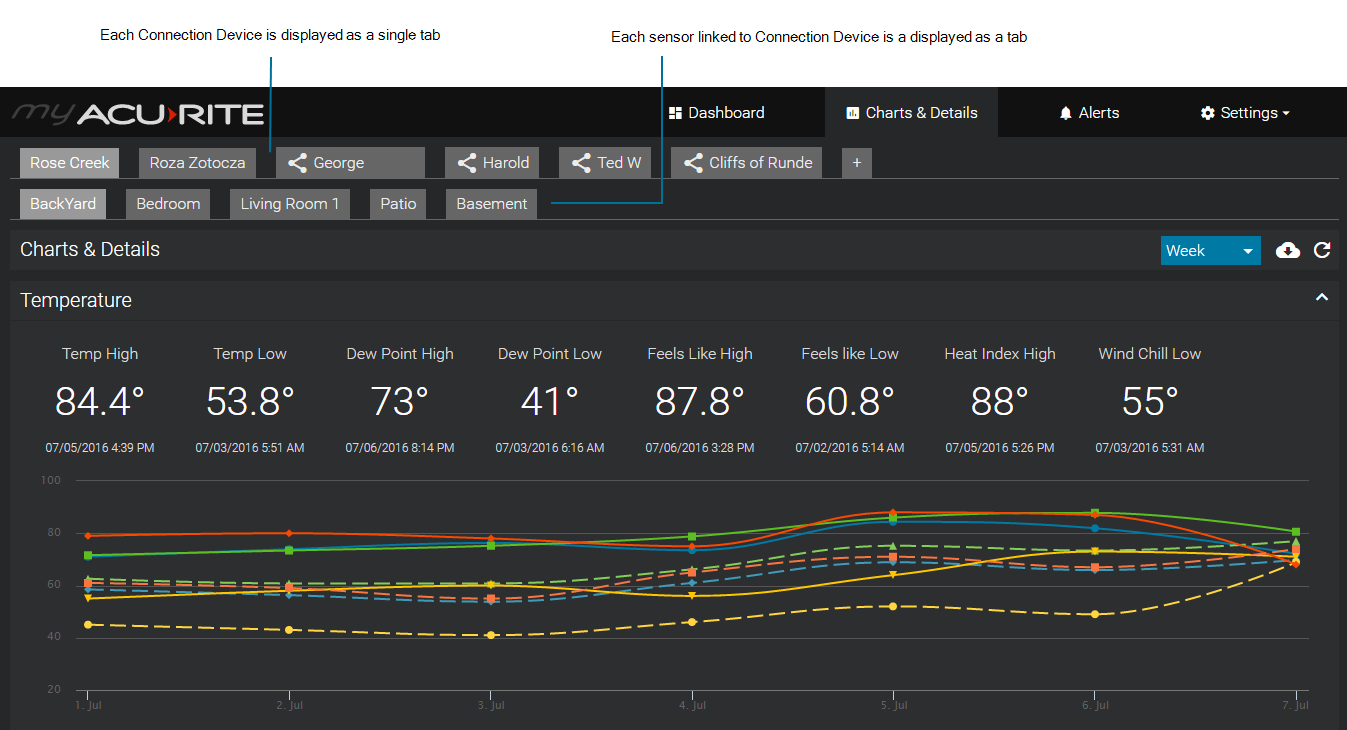
- From the top menu, select Charts & Details.
- Select the name of a sensor to view its readings in a chart.
Each sensor is displayed in the tab of its Connection Device.
How to change the time period displayed
From the drop-down menu, located in the upper right area of the reading type, select a time period. As a point of reference, the specific date or date range is also displayed for the time period selected.
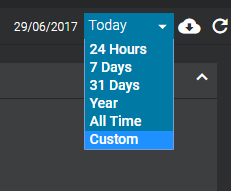
Chart time period options
By default, the Today's readings are displayed. Located to the left of the drop-down time period, the date or date timeframe for the time period selected is displayed.
Today - includes readings starting today at 12:00 AM through the last recorded reading. Readings data points are displayed in 5 minute intervals.
24 hours - includes the readings for current hour and the previous 23 hours. Reading data points are displayed in 5 minute intervals.
7 Days - includes readings from today and the previous 6 days. Reading data points are displayed in a daily interval and each day includes reading records.
31 Days - includes readings from today and the previous 30 days. Readings are displayed in a daily interval and each day includes its record readings.
Year - displays the lowest and highest readings recorded in the current year. A chart is not displayed - only reading information is displayed.
All Time - displays reading records from the date your My AcuRite account was created. A chart is not displayed - only reading information is displayed.
Custom - set the chart to display a specific start and end date for the last 31 days. Reading data points are displayed in 5 minute intervals.
How to filter the type of readings displayed in a chart
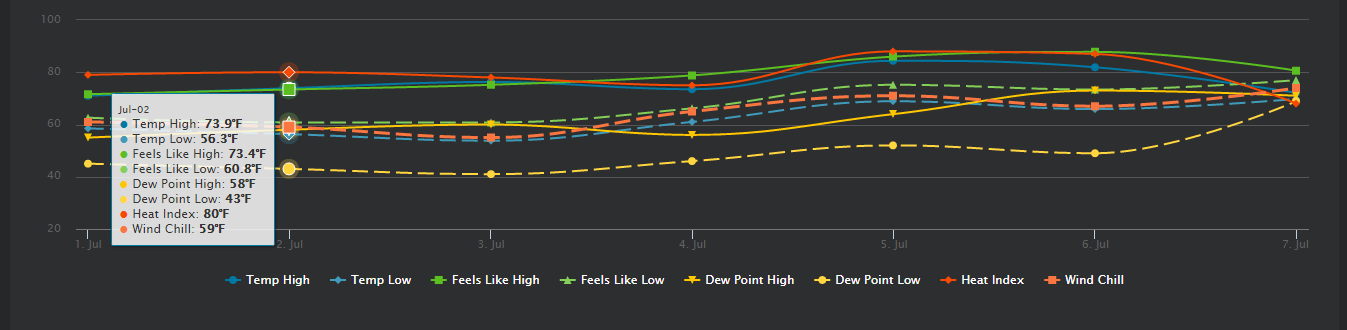
Located on the bottom of a chart is a reading filter.
- Select a reading type to toggle the reading to be displayed or not to be displayed.

How to view the details of a data point
- Hover over the data point.
Update data
Chart data is automatically updated every 5 minutes.
- To update (refresh) the data manually, select the
 icon.
icon.